

Consumption poorly explained
The fuel cost is read in the final balance, without context on the route, vehicle and use.
Zenit connects compatible CAN and vehicle signals with location, mileage and activity to analyse fuel use, engine status and idling. Available signals, resolution and any diagnostic use depend on the vehicle, ECU, protocol, device, installation and configuration: there is no universal accuracy figure.
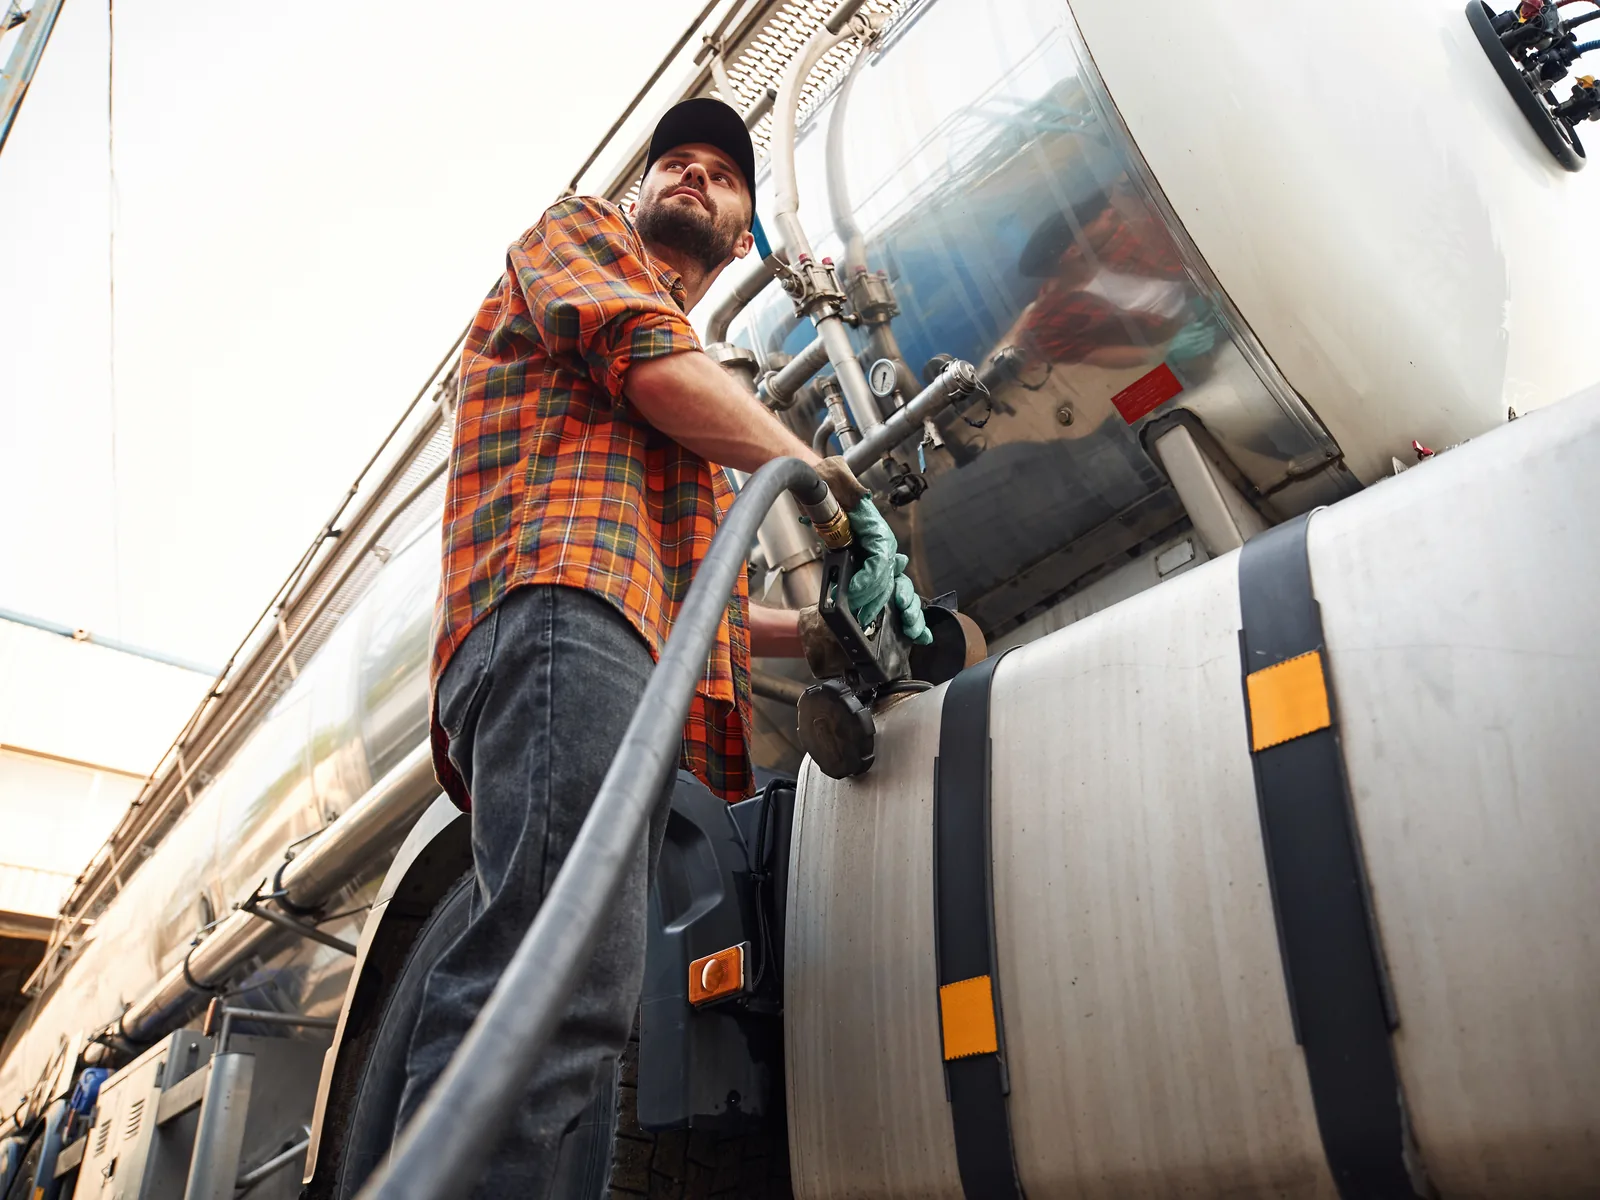
Fuel, engine idling, driving style and anomalies can affect costs. Checking them requires available data linked to the vehicle, journey and time.
Consumption poorly explained
The fuel cost is read in the final balance, without context on the route, vehicle and use.
Idle time not visible
Engine running times and operational stops may be left out of the decision reports.
Disconnected driving style
Accelerations, braking and use do not always feed coaching or in-house policies.
Late anomalies
Technical signals and recurring behaviours are detected when they already have an impact.
Responsive maintenance
Interventions and checks do not communicate sufficiently with km, engine use and vehicle data.
Non-operational analyses
A lot of data is not enough if it does not become KPIs, priorities and shared actions.
Zenit links available signals to the vehicle, journey and time to help the team understand what needs checking.

Fleet
Each vehicle with its use and its status.
The screenshots show the Zenit demonstration environment: no connection to the customer operating platform and no guaranteed savings.
Zenit links compatible signals to journeys, drivers, fuel, maintenance and reports when the vehicle and configuration support them.
Isolated data
Technical readings
The vehicle data remains available, but difficult to use for daily decisions.
Final costs
Fuel and maintenance are analyzed when the expense has already occurred.
Non-contextual anomalies
A technical signal without route, use and means risks being ignored.
Data in the Zenit system
Readable signals
Consumption, km, idle time and anomalies are sorted by priority.
Operational analysis
The data is read together with the route, driving style and use of the vehicle.
Informed maintenance
Interventions and checks can be planned with more context.
Data availability depends on vehicles, devices and configuration. The demo clarifies which signals are applicable to your fleet.
Vehicle data
CAN bus readings and technical signals available based on vehicle and configuration.
Fuel and consumption
Trends and deviations in available values, read in route and activity context.
Driving style
Compatible events for coaching and policy, with purposes and safeguards defined by the organisation.
Engine use
Engine status, speed, hours or other parameters where the vehicle exposes them compatibly.
kilometres
Mileage and usage linked to maintenance, costs and reports.
Idle time
Stops with engine running and unproductive times to be read in the operational context.
Maintenance
Mileage and engine hours can feed due dates; diagnostics and prediction require confirmation.
Anomalies
Events and trends to check before they become recurring problems.
Operational analysis
KPIs and reports to link vehicle data to fleet decisions.
CAN defines communication between electronic nodes; the application parameters available depend on the vehicle and protocols used above the network layer.
CAN means Controller Area Network and is a communication technology for electronic nodes. ISO 11898-1 defines the data-link layer and signalling; it does not guarantee that every vehicle makes the same set of application parameters available.
GPS describes position, movement and time. Compatible vehicle signals can add engine status, speed, mileage, hours and fuel values. The two sources answer different questions and become more useful when aligned to the same operating interval.
CAN reports values made available by the control units; an external sensor adds a dedicated measurement. The choice depends on the objective, compatibility, tanks, resolution, installation and calibration. This page does not present probes or specific readings as available without a project check.
| Criterion | CAN data | External sensor |
|---|---|---|
| Origin | Vehicle control unit and signals | Component added to a tank or circuit |
| Compatibility | Depends on ECU, protocol and mapping | Depends on tank, installation and interface |
| Calibration | Depends on the value exposed by the vehicle | Depends on the sensor installation and procedure |
| Choice | Validate on the vehicle and intended use | Validate on the vehicle and intended use |
Make, model, year, body, ECU, protocol, device, wiring, mapping and configuration can change data availability, frequency and quality. No fuel or diagnostic accuracy should be transferred from one vehicle to another without evidence.
| Action | What it means | Prudent boundary |
|---|---|---|
| Detect | Observe a change or deviation in available data | Depends on signal, resolution and configuration |
| Alert | Notify a configured rule | Does not prove the cause of the event |
| Analyse | Compare fuel use, refuelling, location, time and history | Supports human verification |
| Prevent | Physically stop theft or use | Not a promise of this module |
ISO 11898-1 describes the CAN data-link layer; SAE J1939 describes a communications family used in heavy-duty vehicles. The standards explain the network, not which signals a specific vehicle exposes.
Zenit avoids unverified percentages: it shows available data and possible anomalies, then the company decides which checks and actions to take.
Explainable consumption
Connect fuel, route, vehicle, driver and operating conditions.
Use of the lightest vehicle
kilometres, idle time and engine usage become readable indicators.
Informed maintenance
Signals and anomalies can support controls and planning.
Report by management
Technical data become useful summaries of costs and priorities.
Measure
Vehicle data, consumption, km and idle time.
Compare
Routes, vehicles, behaviours and anomalies.
Intervene
With policies, maintenance and operational actions.
Which signals a vehicle displays on the on-board network changes with the brand, year and setup: it occurs on the real fleet before installation, because a report built on a signal that that vehicle does not display is born empty. No savings percentage appears on this page — a savings without data, period, context and calculation method is not a given, it is a promise.
Consumption is read on the working unit of the vehicle, and it is not always per kilometre.
Transport and logistics
On long routes, consumption depends on load, route and driving style together: separating them requires vehicle data.
Construction and construction sites
On a construction vehicle the fuel is used up with the engine running and the car stopped. Sometimes it's work, sometimes it's idle: only the engine hours say so.
waste collection
Short distances, many restarts, a lot of time with the engine running: here the consumption is read by the lap, not by the kilometre.
Fleet rental
Consumption is produced by those who have the vehicle in use, and when returning it you need to know how much and in what conditions.
The same deviation, four different consequences.
Fleet Manager
«This vehicle consumes more than its twin: is it the vehicle or is it the person driving it?»
Maintenance Manager
«Do the real engine hours tell me when to intervene before something breaks?»
CFO
«Can the fuel item I see on the balance sheet be explained by the work that was done?»
Entrepreneur / CEO
“How much of the fuel I pay becomes work?”
Responses oriented to available data, conservative results and connection with maintenance and policy.
No. Zenit helps to read fuel, consumption, idle time, use and anomalies, but does not guarantee savings percentages. Results depend on fleet, processes, policies and actions taken.
Possible data includes engine status and speed, mileage, engine hours, fuel use or level and driving signals. No list is universal: availability and quality depend on the vehicle, ECU, protocol, device, installation, mapping and configuration.
Compatible data such as mileage, engine hours and usage status can feed maintenance due dates and checks. Diagnostic reading, fault codes and predictive maintenance should not be assumed: they must be confirmed for the vehicle and project.
Zenit can make useful signals for coaching and company policies legible. The use of data must be consistent with responsibility, in-house communication, privacy and purposes defined by the company.
CAN uses values made available by the vehicle's control units; an external sensor measures through an added component. Neither is universally better: compatibility, resolution, tanks, installation, objective and calibration must be checked on the vehicle. Zenit does not presume that external probes are available.
There is no universal accuracy figure. Data can depend on the ECU, protocol, signal resolution, tank shape, calibration, device and operating conditions. Accuracy must be assessed on the vehicle and required use without presenting a telematics reading as a certified measurement.
No. The platform can analyse fuel use, refuelling and changes in compatible signals and can surface configured deviations. Detecting, alerting, analysing and preventing are different actions; probes, tank-level drops and theft-specific alarms require technical confirmation for the project.
Zenit can help you understand what vehicle data is available, how to read it and how to link it to costs, maintenance and driving behaviour.
We use necessary technical cookies. With your consent, we may use analytics cookies to measure the site and Meta Pixel to attribute campaigns, build audiences and personalise advertising. You can reject or choose each category; the site will still work. Cookie policy · Privacy policy